Power BI DAX: Calculate Running Total for Past N Days, excluding the days that don't match criteria.
Creating a Running Total is pretty simple in DAX, you just take a measure, wrap it inside CALCULATE and then with the help of DATESYTD you can start cumulative total for Dates, Month and one Year ( DATESYTD ) resets at the beginning of new year or any date that you specify in the second argument.
Below is an example of a running total using DATESYTD:
One of the problems with DATESYTD is that it does not offer the ability to implement any kind of logic, by logic I mean the ability to filter dates based on the business conditions and then run a cumulative total on it.
Fortunately, when you start thinking more in terms of DAX algorithm or the vanilla DAX you start to see that you have a lot of options available, and therefore this post is dedicated to such problems that you have seen or might face in future.
Problem Statement:
-
You are a fitness enthusiast and hence you always keep a track of the steps that you have taken in a day. Few months/years have passed since you started this activity.
-
Now you want to see how your running total looks like, but the catch is that at each day level in your report you want to go back exactly 60 days and check what your running total looks like since the start ( Current browsing level in the report minus 60 days ).
-
Easy right? let us increase the stakes a little bit, you are also interested in skipping the days that have less than 1000 steps, now the logic is even more difficult to define, how would you deal such kind of calculation? It seems easy to do but defining the logic is difficult.
-
Mainly because even if you skip the days that have less than 1000 steps using FILTER, when you go back 60 days using MAX ( Dates[Date] ) - 60, this part gets you to 60 days before the date that you are currently browsing, which is fine in most cases but remember we have already skipped days that didn't satisfy the criteria, so if you are currently browsing the report at 19th November 2020 then MAX ( Dates[Date] ) - 60 would get you to 20th September, 2020, which could be the right date to start/reset the running total in case every day had steps more than or equal to 1000, but what to do in case if some days in between didn't satisfy the criteria?
-
Can you think of a solution? I want you to try to think for a minute before proceeding ahead.
Ready? The PBI and CSV file are available at: Download Files
File Contents:
-
Steps Raw Data.csv contains the Data that has been retrieved from your fitness device
-
Steps Report.pbix contains the actual data model which has 2 tables, 'Steps' and one 'Date' table used for filtering the Steps table and calculating running total, a proper Date table is always necessary for any kind of time intelligence calculation that you want to do. Please do not rely on the automatic dates table that PBI creates for you. They are not re-usable and bloats the PBI file.
This is how the Steps data looks like:
View of Data Model:
Final Report:
Creating Base Measure:
1 2 | Total Steps = SUM ( Steps[Steps] ) |
1 2 3 4 5 6 7 8 9 10 11 12 13 14 15 16 17 18 19 20 21 22 23 24 25 26 27 28 29 30 |
Running Total = VAR MaxDate = MAX ( Dates[Date] ) VAR TimePeriod = 60 VAR PopulateDatesWithTotalSteps = ADDCOLUMNS ( ALL ( Dates[Date] ), "@Steps", [Total Steps] ) VAR FilteredSteps = FILTER ( PopulateDatesWithTotalSteps, [@Steps] >= 1000 ) VAR RankDates = ADDCOLUMNS ( FilteredSteps, "@DayRank", VAR CurrentDay = Dates[Date] VAR Result = COUNTROWS ( FILTER ( FilteredSteps, Dates[Date] <= CurrentDay ) ) RETURN Result ) VAR RankAtCurrentDate = MAXX ( FILTER ( RankDates, Dates[Date] = MaxDate ), [@DayRank] ) VAR FromCurrentDateFilterPastNDays = FILTER ( RankDates, [@DayRank] <= RankAtCurrentDate && [@DayRank] > RankAtCurrentDate - TimePeriod ) VAR Result = SUMX ( FromCurrentDateFilterPastNDays, [@Steps] ) RETURN Result |
-
MaxDate variable returns the MAX date at which you are currently browsing the report if you are on 1st January 2020 then it is the MAX date in the filter context, if you are at 2nd February, 2019 then it is the MAX date in the filter context, if you are at July level then 31st July 2020 is the MAX date in the current filter context.
-
TimePeriod is self-explanatory it is just a constant that allows you to jump back N number of days.
-
PopulateDatesWithTotalSteps - This is the first variable which has some complexity, what does it do?
-
ALL ( Dates[Date] ) returns all the dates in the 'Dates' table, ignoring any filter context present in the report, so if you are at 1st January, 2020 you get all the dates, similarly if you are at 11th November, 2020 you still get all the dates, this is useful for 2 purposes, first is that having all dates at any given cell in the report allows you to traverse back and forth for that cell, secondly pre-populating Total Steps for all dates allows in optimized queries as the request sent to Storage Engine are reduced significantly.
-
ADDCOLUMNS iterates the dates returned by ALL ( Dates[Date] ) and populate Total Steps using context transition. What is context transition? Each measure has a hidden CALCULATE wrapped around it, when you call a measure in a row context, that hidden CALCULATE initiates context transition, which is the process of transforming the currently iterated row into an equivalent filter context so that the measure can be evaluated in the newly modified filter context by the context transition executed by CALCULATE, if the context transition was initiated for 1st January 2016, then the [Total Steps] code become: CALCULATE ( [Total Steps], Dates[Date] = "01 January 2016" ) and this step is repeated for each row of the table specified in the first part of ADDCOLUMNS.
-
Since we have used variables, and some of them returns table, we can visualize the intermediate steps by using this code in a Table. Now that we have our temporary table let us move ahead but wait! What is a temporary table? it is a table that can be calculated on fly in memory using DAX.
-
FilteredSteps - This variable keeps the rows where [@Step] temporary column has value greater than or equal to 1000, you can visualize the result by calling variable name at the end of the calculated table's code.
-
RankDates - This variable is the heart of the code, the problem as stated earlier is to go back 60 days once the steps are filtered, in a simple case where we wouldn't have removed the steps we could simply rely on going back by using the logic MAX ( Dates[Date] ) - 60 and that would be going back on the basis of calendar but in this case we need to go back 60 days on the basis of the data returned by FilteredSteps variable, how does one achieve that? Rank it! How? Dates in DAX are just integer numbers since 12/30/1899 and fortunately we can rank numerical values, so we start to rank:
-
The first step is to add a new temporary column named "@DayRank" to the existing temporary table stored in the variable FilteredSteps
-
The first variable named CurrentDay sets the reference to the currently iterated date by the ADDCOLUMNS, we are using variables to improve readability and efficiency of the code so that we do not end up duplicating code, it is better to store result in a variable and then use it as many times you want.
-
The code in the second variable named Result first iterates the virtual table available in the FilteredSteps and starts to Rank them by filtering out dates that are less than or equal to the Date currently iterated by ADDCOLUMNS and stored in the variable CurrentDay, once the list of dates are prepared, FILTER returns the table to COUNTROWS for counting the number of rows that are less than or equal to the currently iterated row/date and then COUNTROWS returns the row count for the new temporary column.
-
Calculation is done for every row of FilteredSteps and then ADDCOLUMNS ends its execution and a new table with Rankings is available in memory, and you can visualize its result by returning RankDates variable in the code of calculated table.
-
RankAtCurrentDate - This variable iterates the table with Ranks from RankDates variable/virtual table and fetches the Rank at the current level at which you are browsing, i.e., for day, month and year accordingly.
-
FromCurrentDateFilterPastNDays - This variable iterates RankDates virtual table and checks for all the dates that are less than the MAX date of the level at which you are browsing and gets 60 dates less than the MAX date and the Rank at the current date.
-
Result - The final thing to do is to SUM the # Steps for the days that are returned by the previous step which has 60 days, by using SUMX
Finally, if you want to verify you can use the below option to get data in csv format and then using Excel you can filter out the dates where Steps are greater than or equal to 1000 and then sum them and you will get the desired result.
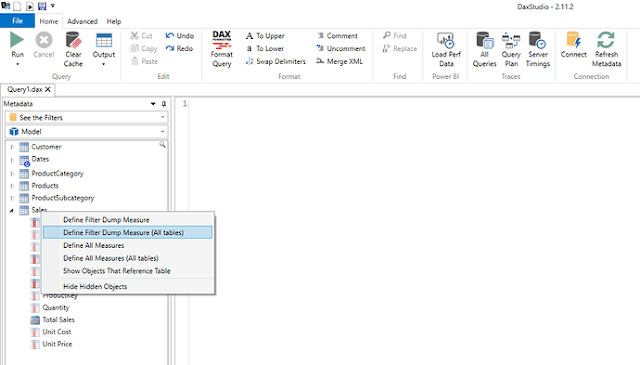
Testing the code in DAX Studio - Just to check for any CALLBACKDATAID or anything that could cause some slow queries) just follow the steps highlighted in the below image:
Once you have copied the query to clipboard just paste the query copied from the step 4 and open DAX Studio
Turn on the Server Timings and make sure you select Clear Cache and Run otherwise in the subsequent runs the engine will use the cache and your query will run much faster and you will not be able to make any analysis or optimization on that.
When you paste the query, you will see a lot of garbage code that you do not need so you can remove it, and make it look like how it looks in the below image:

Original Query which is extracted from DAX Studio:

Cleaned up version:
If you run this code it runs in approximately 582 seconds

The code is not a very fast query considering we are only dealing with 1785 rows of fitness data, so what can we do further do optimize it? We will have to look into the XMSQL code generated by it.

This query in the last 2 images are the done because of ADDCOLUMNS ( ALL ( Dates[Date] ), "@Steps", [Total Steps] ) code in our measure.
The first Vertipaq query is doing a SUM of Steps by applying a LEFT JOIN on the Dates table and for each row of Dates[Date] adds the total steps available in the Steps table.
The Second Vertipaq query extracts the list of Dates from Dates table, because of ALL ( Dates[Date] ) construct in our measure.
The third Vertipaq Query is simply retrieving the MAX ( Dates[Date] ) from the current filter context, but look at the #Rows it has to materialize, i.e. 1830 rows, and that is something we can optimize first.
If instead of using MAX I use SELECTEDVALUE the total Vertipaq queries are reduced to 2.

The third Vertipaq MAX query is completely removed and look at the Total Execution time it has reduced from 582ms to 552ms, now what if I told you we can do much better than this?
In a Tabular model if you are referencing columns from different tables, you have to pay a price for the JOIN used, in this case we can actually eliminated the LEFT JOIN by only operating on the Steps table.
The new code will look like this, the change is in the FilteredSteps variable:
1 2 3 4 5 6 7 8 9 10 11 12 13 14 15 16 17 18 19 20 21 22 23 24 25 26 27 28 29 30 31 32 |
Running Total = VAR MaxDate = SELECTEDVALUE ( Dates[Date] ) VAR TimePeriod = 60 VAR FilteredSteps = CALCULATETABLE ( SUMMARIZE ( Steps, Steps[Steps], Steps[Date] ), Steps[Steps] >= 1000, ALL ( Steps ) ) VAR RankDates = ADDCOLUMNS ( FilteredSteps, "@DayRank", VAR CurrentDay = Dates[Date] VAR Result = COUNTROWS ( FILTER ( FilteredSteps, Dates[Date] <= CurrentDay ) ) RETURN Result ) VAR RankAtCurrentDate = MAXX ( FILTER ( RankDates, Dates[Date] = MaxDate ), [@DayRank] ) VAR FromCurrentDateFilterPastNDays = FILTER ( RankDates, [@DayRank] <= RankAtCurrentDate && [@DayRank] > RankAtCurrentDate - TimePeriod ) VAR Result = SUMX ( FromCurrentDateFilterPastNDays, [Steps] ) RETURN Result |
What is different now? instead of ADDCOLUMNS ( ALL () ) construct, I am using CALCULATETABLE ( SUMMARIZE () ) construct which helps in eliminating the need for the LEFT JOIN.
This time Query time has not reduced, but the rows materialized by Storage engine has reduced by a little bit. Also you can see that there is no Left JOIN.

The optimization doesn't end here, in the beginning I used the COUNTROWS ( FILTER () ) construct to Rank Dates, the main purpose of this construct was to explain the process to you, but in real world case you may not need it and can replace it completely with RANKX which highly optimizes the code in this case.
The Final version of the optimized code is this:
1 2 3 4 5 6 7 8 9 10 11 12 13 14 15 16 17 18 19 20 21 22 23 24 25 26 27 |
Running Total Fast = VAR MaxDate = SELECTEDVALUE ( Dates[Date] ) VAR TimePeriod = 60 VAR FilterStepsGreaterThan1000 = CALCULATETABLE ( SUMMARIZE ( Steps, Steps[Steps], Steps[Date] ), Steps[Steps] >= 1000, ALL ( Steps ) ) VAR RankDates = ADDCOLUMNS ( FilterStepsGreaterThan1000, "@DayRank", RANKX ( FilterStepsGreaterThan1000, Steps[Date], Steps[Date], ASC ) ) VAR RankAtCurrentDate = MAXX ( FILTER ( RankDates, Dates[Date] = MaxDate ), [@DayRank] ) VAR FromCurrentDateFilterPastNDays = FILTER ( RankDates, [@DayRank] <= RankAtCurrentDate && [@DayRank] > RankAtCurrentDate - TimePeriod ) VAR Result = SUMX ( FromCurrentDateFilterPastNDays, [Steps] ) RETURN Result |
This version of the measure doesn't further reduce the rows materialized by Storage Engine/Vertipaq but it cuts down the execution time to nearly half of the original query. From 582ms to 338ms.

All the version of the measures are included in the PBI file available at Download Files


Comments
Post a Comment