Power BI DAX Context Transition - Behind the scenes
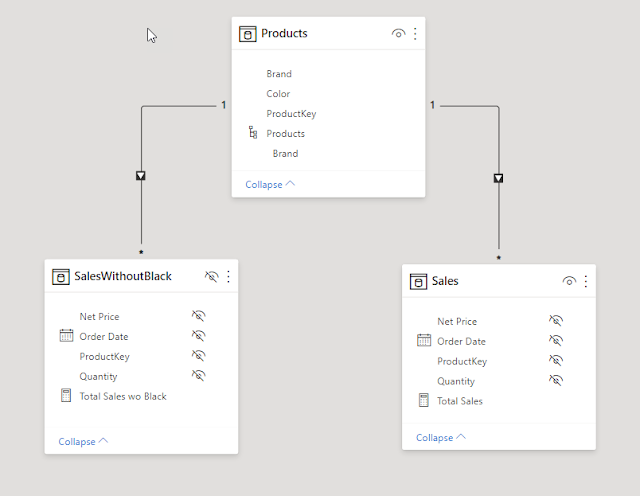
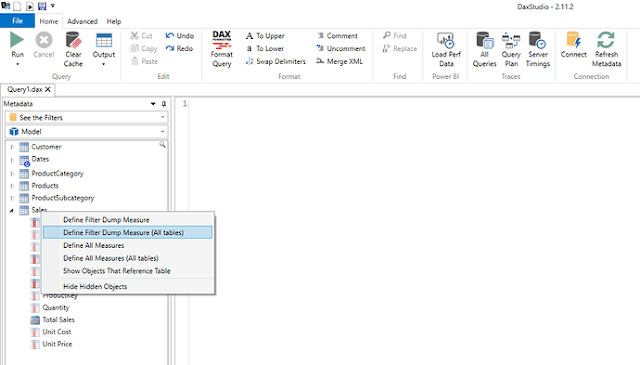
Context transition - one of the most complex topics to understand and master but have you ever wondered, what actually happens behind the scenes? To be honest at least for me the behind the scene stuff is much more clear and easy to understand. Without diving too deep into theoretical aspect, If I have to explain context transition to a layman I had say take every value of all the columns of the current row in which a measure or an expression inside CALCULATE is called and then convert all the row values into a filter context under which the measure will be evaluated. And this is done for each row of the table where measure is called. And behind the scenes Context Transition it is just like a VLOOKUP between two data cache. Snapshot of the data model (Contoso) used: If you connect your model to DAX Studio and turn on Query Plan and Server Timings and run a simple query like the one below: The result you get is a list of unique Colors with the Sales amount: Now if you navi...